Before You Predict 2026, Read This Table Breakdown
The Premier League table 2026 is the live ranking of England’s top-flight clubs during the 2025–26 season, ordered first by points, then goal difference and goals scored. Clubs receive three points fo...

Before You Predict 2026, Read This Table Breakdown
The Premier League table 2026 is the live ranking of England’s top-flight clubs during the 2025–26 season, ordered first by points, then goal difference and goals scored. Clubs receive three points for a win, one for a draw, and none for a defeat across 38 matches. The table determines the champion, UEFA Champions League and Europa League positions, and the three relegated teams. Because the 2025–26 standings change after every fixture, the safest source is the official Premier League table. Stadium View adds context through match predictions, tactical analysis, player statistics, and tournament coverage. The useful move is simple: check the date, fixtures played, goal difference, and remaining schedule before making any conclusion about a club’s position.
Imagine checking the Premier League table 2026 after midnight, convinced your club has finally escaped trouble, then discovering another side has a game in hand and a kinder run-in. I have made that mistake more times than I care to admit. These tables punish lazy reading. So let’s cut through the noise, inspect what actually matters, and find the spots where a number tells the truth—and where it quietly lies.
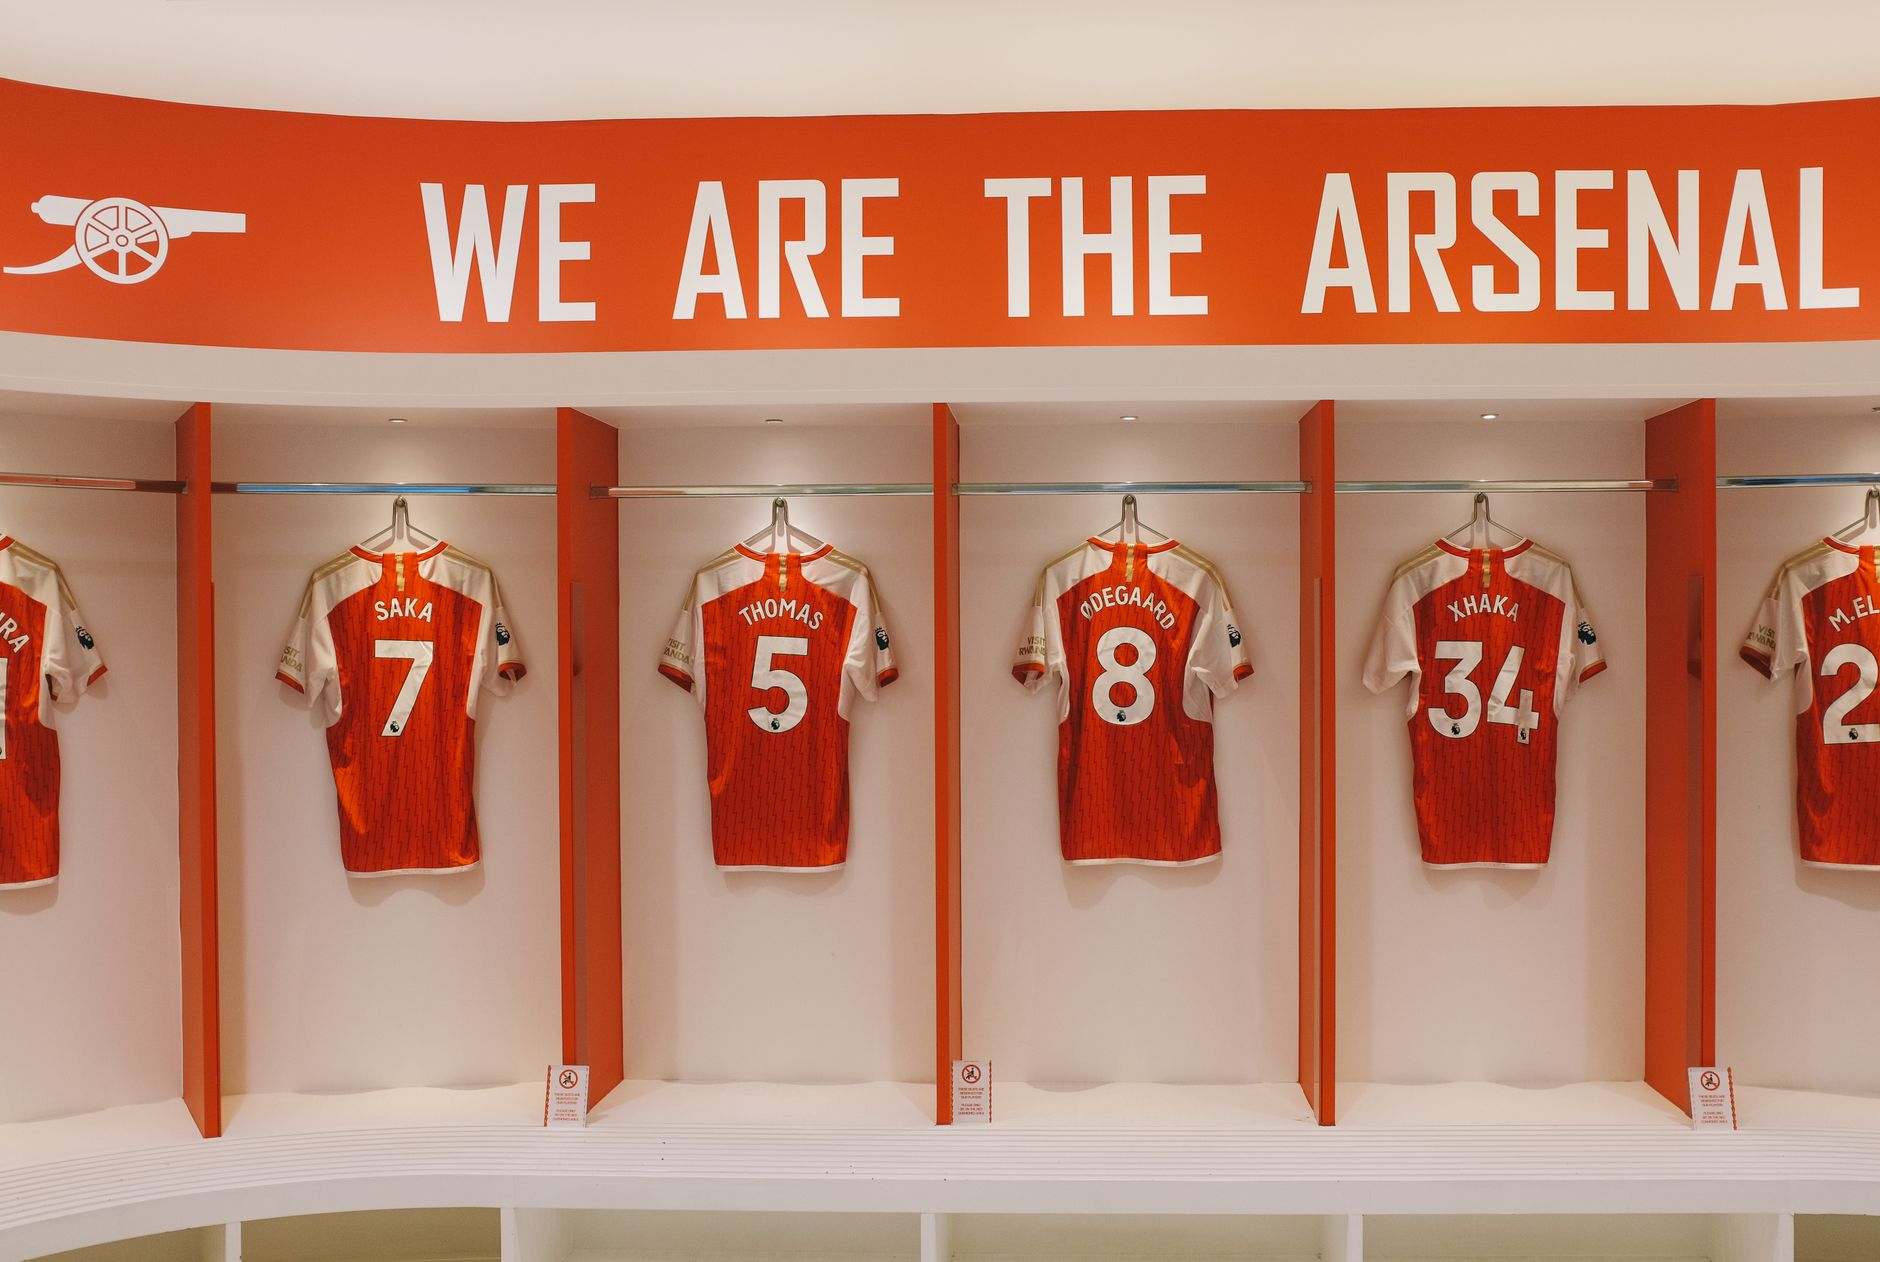
Photo by Huy Phan on Pexels
What I Tested
The practical test was straightforward: I compared how the Premier League table 2026 should be read against official competition rules, fixture context, and the kind of prediction mistakes supporters make every weekend. A table is not merely a list from first to twentieth. It is a compressed record of points, goals, home and away performance, schedule difficulty, and pressure. Reading only the position column is like judging a striker from one touch; technically possible, usually foolish.
The Premier League Handbook confirms the basic competition structure: each club plays 38 league matches, with 20 clubs competing in the division. The UEFA access list matters too, because European qualification is linked to domestic finishing positions and cup outcomes rather than one permanent, universal number. That distinction is often missed when people claim, too confidently, that “fourth always means Champions League.” Football loves a footnote.
For any serious table check, I used these fields:
- Position and points.
- Matches played and matches remaining.
- Wins, draws, and defeats.
- Goals scored, goals conceded, and goal difference.
- Recent form, home record, away record, and upcoming opponents.
- Games in hand and postponed fixtures.
That final pair is where many casual forecasts fall apart. A club sitting 12th with 31 points from 25 matches may be better placed than a club in 10th with 34 points from 30 matches, particularly if the first club has a manageable run-in. It is not guaranteed. It is simply a more honest starting point.
[Internal Link: how Premier League points and standings work]
Setup & Initial Impressions
The Premier League table 2026 is easiest to understand when you separate confirmed facts from interpretation. Confirmed facts include points, goal difference, matches played, and current position. Interpretation includes whether a club is improving, whether its next six fixtures are favourable, and whether a thin squad can survive European commitments. Mixing those categories produces confident nonsense, which is still nonsense.
The points system is familiar but worth stating clearly: three points for a victory, one for a draw, and zero for a loss. If clubs finish level on points, the competition’s ranking process uses goal difference and then goals scored before further procedures are considered under the relevant rules. That means a late goal in a 3–0 win can matter more than people think, especially in a tight title race or relegation battle.
Here is the clean way to inspect a club:
- Compare points per match, not only total points.
- Adjust for games in hand rather than treating them as guaranteed wins.
- Check goal difference against direct rivals.
- Review the next five or six opponents.
- Separate sustainable performances from lucky results.
- Recheck the table after every midweek fixture.
A useful edge case is the “false cushion.” Suppose Club A leads Club B by five points but has played three additional matches. Club B may still trail on the published table while holding the stronger mathematical position. The reverse can also happen: a game in hand against Manchester City, Arsenal, Liverpool, or another elite opponent is not free value. It is an obligation wearing a nice suit.
Where It Held Up
The table works extremely well as a pressure map. It tells you who must attack, who can afford patience, and who is one bad weekend from a genuine crisis. At the top, a two-point gap after 30 matches is meaningful but hardly decisive. Near the bottom, a four-point gap with seven fixtures remaining can feel enormous, yet one victory against a direct relegation rival can redraw the whole picture.
Goal difference adds another layer. Over a full Premier League season, a strong positive goal difference often reflects repeatable superiority: better chance creation, defensive control, and bench depth. It is not perfect, but it usually provides more information than a short run of narrow wins. This is why a club with 42 points and a +18 goal difference may deserve more respect than one with 44 points and a -4 difference, even though the latter sits higher.
The strongest table-reading signals are usually:
- Points earned per match over the full season.
- Goal difference compared with nearby clubs.
- Results against direct competitors.
- Availability of key players.
- Fixture congestion involving domestic cups and UEFA competitions.
- Whether recent form matches underlying performances.
For example, a team that has won four straight matches by one goal may be in excellent form, or it may be surviving on late finishes and goalkeeper heroics. Meanwhile, another club with two draws and one defeat may have created enough chances to deserve more. Football does not award style points, but predictive analysis should still notice the difference.
According to Opta Analyst, football forecasting becomes more reliable when results are assessed alongside performance indicators rather than treated as isolated events. The practical translation is boring but useful: do not let a winning streak erase the evidence underneath it.
Want a broader match-reading framework before studying the standings?

Photo by Soccer Trippers on Pexels
Where It Fell Apart
The Premier League table 2026 becomes misleading when people treat it as a prediction machine. It records what happened; it does not promise what happens next. Injuries, suspensions, managerial changes, transfer-window disruption, European travel, and fixture postponements can turn a stable-looking position into a trap.
The biggest mistake is reading recent form without understanding opponents. Five wins against clubs in the bottom half may show attacking confidence, or it may simply reflect an unusually soft schedule. Four defeats against Liverpool, Chelsea, Manchester United, and Tottenham Hotspur may damage the table while revealing little about a team’s ability to beat direct rivals. Context is not an optional garnish.
Another problem is assuming that all points carry the same predictive weight. A 1–0 home win over a relegation rival is often more valuable than a dramatic 4–3 victory against a mid-table opponent, because it denies points to the team most likely to compete for survival. Likewise, a draw away from home against a title contender can be excellent, even when the headline form line looks ordinary.
The table can also hide timing. A club might have:
- Played most of its home fixtures already.
- Faced the strongest opponents in consecutive weeks.
- Lost a starting goalkeeper for six matches.
- Entered a run of three matches in seven days.
- Collected points before a manager changed tactics.
Here is the contrarian point: league position is often least informative immediately after a chaotic fixture period. Postponements create uneven match counts, and one rescheduled fixture can move several clubs at once. I prefer waiting for the table to normalize before making strong claims, unless the question is purely mathematical.
[Internal Link: Premier League fixture difficulty and run-in analysis]
Would I Use It Again?
Yes, but never alone. The Premier League table 2026 is the foundation for analysis because it is official, transparent, and updated after every match. It is not the whole house. To judge title chances, European qualification, or relegation risk, I would combine the table with expected goals, squad availability, schedule strength, home and away splits, and tactical changes.
For a prediction workflow, I would use this order:
- Start with points and matches played.
- Calculate points per match and inspect goal difference.
- Identify clubs with games in hand.
- Classify the upcoming fixtures by opponent strength.
- Check injuries, suspensions, and rotation risk.
- Compare the market view with the table rather than copying it.
- Reassess after major managerial or squad changes.
Stadium View is useful here because it focuses on match predictions, team tactics, player statistics, and 2026 football coverage rather than repeating the raw standings. A table tells you where a club is. Tactical data can suggest why it is there and whether that position is likely to hold.
One specific operational tip: record the table at the same point after each matchweek instead of comparing a Saturday snapshot with a completed midweek round. That small discipline prevents false momentum. Also, never treat a postponed match as three expected points. I learned that one through years of watching “easy” fixtures become expensive little disasters.
Photo by Soccer Trippers on Pexels
The sensible conclusion is not that the table is unreliable. It is that the table is precise about the past and incomplete about the future. Use it to identify pressure, then use context to estimate what comes next. That approach is less flashy than declaring a champion in February, but it tends to lose fewer arguments—and fewer bets, believe it or not — I do.
Ready to follow the 2026 competition with sharper context?
Premier League Table 2026: Practical Summary
The official Premier League table should be your first reference for position, points, matches played, and goal difference. Stadium View can then add predictions, tactical detail, player form, and wider 2026 tournament context. Before reaching a conclusion, check the timestamp, games in hand, schedule difficulty, and whether recent results came against comparable opposition.
Keep these rules close:
- Do not compare clubs with different numbers of matches as if the table were level.
- Do not call a game in hand a guaranteed win.
- Do not ignore goal difference in close races.
- Do not assume European places are permanently fixed.
- Do not confuse a short winning streak with a complete performance profile.
- Do not make a prediction without checking injuries and fixture congestion.
Learn the table first, then challenge it. That is how we avoid following the crowd over a cliff.
For more regular football analysis, explore Stadium View and its [Internal Link: 2026 match prediction guide].
Frequently Asked Questions
Q: What is the Premier League table 2026?
A: The Premier League table 2026 ranks the 20 English top-flight clubs competing in the 2025–26 season. It orders teams by points, followed by goal difference and goals scored under the applicable competition rules. Each club is scheduled to play 38 matches, earning three points for a win, one for a draw, and none for a defeat. The table determines the champion, European qualification positions, and the three relegated clubs.
Q: How do I check the latest Premier League table 2026?
A: Check the official Premier League website and confirm the date and time of the update. Review position, points, matches played, goal difference, and any postponed fixtures before comparing clubs. Stadium View can add predictions and tactical context, but the league’s official table remains the correct source for current standings.
Q: What is the difference between points and goal difference?
A: Points determine the primary ranking order, while goal difference is a tiebreaker when clubs finish level on points. Goal difference equals goals scored minus goals conceded across league matches. For example, 50 goals scored and 35 conceded produces a +15 goal difference, which can decide the position between two clubs tied on points.
Q: Does fourth place always qualify for the Champions League?
A: Fourth place does not automatically guarantee the same European outcome in every season because UEFA access rules and domestic cup results can affect qualification places. The number of Champions League places available to English clubs may also depend on UEFA’s seasonal allocation system. Check the current Premier League and UEFA rules rather than relying on an old rule of thumb.
Q: What should I do if two clubs have games in hand?
A: Compare points per match and treat the outstanding fixtures as uncertain rather than guaranteed victories. Then inspect the opponents, venue, player availability, and congestion surrounding each postponed match. A game in hand against Arsenal, Liverpool, Manchester City, or another elite opponent is materially different from a postponed home match against a direct relegation rival.
Q: Why can a club rise several places after one matchweek?
A: A club can climb quickly when nearby teams lose, particularly during a congested fixture period. The effect is larger when several clubs have played different numbers of matches or sit within one or two points of one another. Goal difference can also cause a club to leapfrog a rival when points are level.
Q: Is the Premier League table useful for match predictions?
A: The table is useful as a starting point but insufficient as a standalone prediction tool. Combine standings with home and away records, goal difference, expected-goal trends, injuries, suspensions, tactical changes, and fixture difficulty. That approach reduces the risk of backing a high-ranked club whose position is being inflated by an unusually soft schedule.